
How to Create a Dynamic Account Title in Power BI
Learn how to create dynamic account titles in Power BI that update automatically based on user selections, making your reports interactive and easy to read.
Learn how to create dynamic account titles in Power BI that update automatically based on user selections, making your reports interactive and easy to read.

Learn how to create interactive Power BI reports by building table visuals, adding insightful tooltips, and enabling page navigation for easy movement across report pages.

Discover how to create and format bookmarks in Power BI to design interactive, story-driven reports. This step-by-step guide covers creating bookmarks, linking them to buttons, and customizing visuals to enhance navigation and user experience.

Measures in Power BI are dynamic DAX-based calculations used for aggregations like SUM or AVERAGE. They adjust automatically to filters and visuals, making reports interactive, efficient, and essential for data analysis and KPIs.
Learn how to quickly enhance your Power BI reports by adding a logo, text box, and slicers. These simple elements improve branding, clarity, and interactivity, helping you create more polished and user-friendly dashboards.

Power BI is Microsoft’s business analytics tool that turns data into interactive reports and dashboards, helping organizations make informed, data-driven decisions quickly.
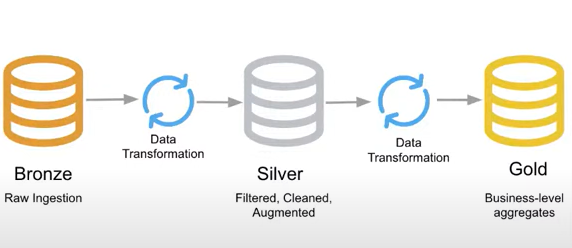
Build a malaria data analysis pipeline in Azure Data Factory—from raw Blob data to clean, analytics-ready insights in Azure Data Lake.
Learn how to set up a Self-Hosted Integration Runtime in Azure Data Factory with a simple, step-by-step guide. This article walks you through creating the IR in ADF, installing the runtime on your machine, and verifying a secure on-premises connection.
Copy data from MySQL to Azure SQL using Azure Data Factory with auto table creation — a quick, no-code way to migrate your data seamlessly.