Creating a Dynamic Account Title in Power BI
A dynamic title in Power BI is a sophisticated text element—usually displayed in a card or visual header—that automatically updates […]
A dynamic title in Power BI is a sophisticated text element—usually displayed in a card or visual header—that automatically updates […]
n modern Business Intelligence, dashboard real estate is a premium commodity. Presenting multiple complex visuals on a single page often
In the world of Power BI, data columns only tell half the story. To unlock the true potential of your
ntroduction: First impressions matter in data storytelling. A report without branding or a clear title can be confusing for stakeholders.
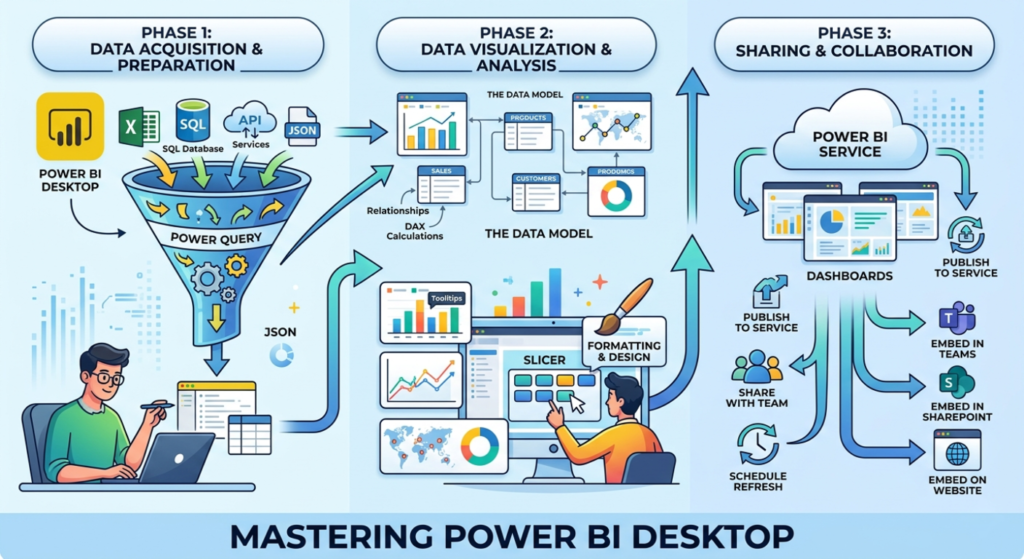
In today’s business landscape, data is only as valuable as the insights you can extract from it. Power BI Desktop

Learn how to create dynamic account titles in Power BI that update automatically based on user selections, making your reports interactive and easy to read.

Learn how to create interactive Power BI reports by building table visuals, adding insightful tooltips, and enabling page navigation for easy movement across report pages.

Discover how to create and format bookmarks in Power BI to design interactive, story-driven reports. This step-by-step guide covers creating bookmarks, linking them to buttons, and customizing visuals to enhance navigation and user experience.

Measures in Power BI are dynamic DAX-based calculations used for aggregations like SUM or AVERAGE. They adjust automatically to filters and visuals, making reports interactive, efficient, and essential for data analysis and KPIs.